Mastering Zabbix: Understanding Servers, Agents, and Proxies
Whether you're just stepping into the world of monitoring or you've been staring at Zabbix dashboards for years, it helps to understand how all the pieces fit together. Zabbix relies on a few key components—like servers, agents, and proxies—to keep an eye on your environment. Here's a quick breakdown of how these parts work and why they matter.
Read On
Zabbix 101: A Clear Guide to Servers, Agents, Proxy & More
Server Overview:
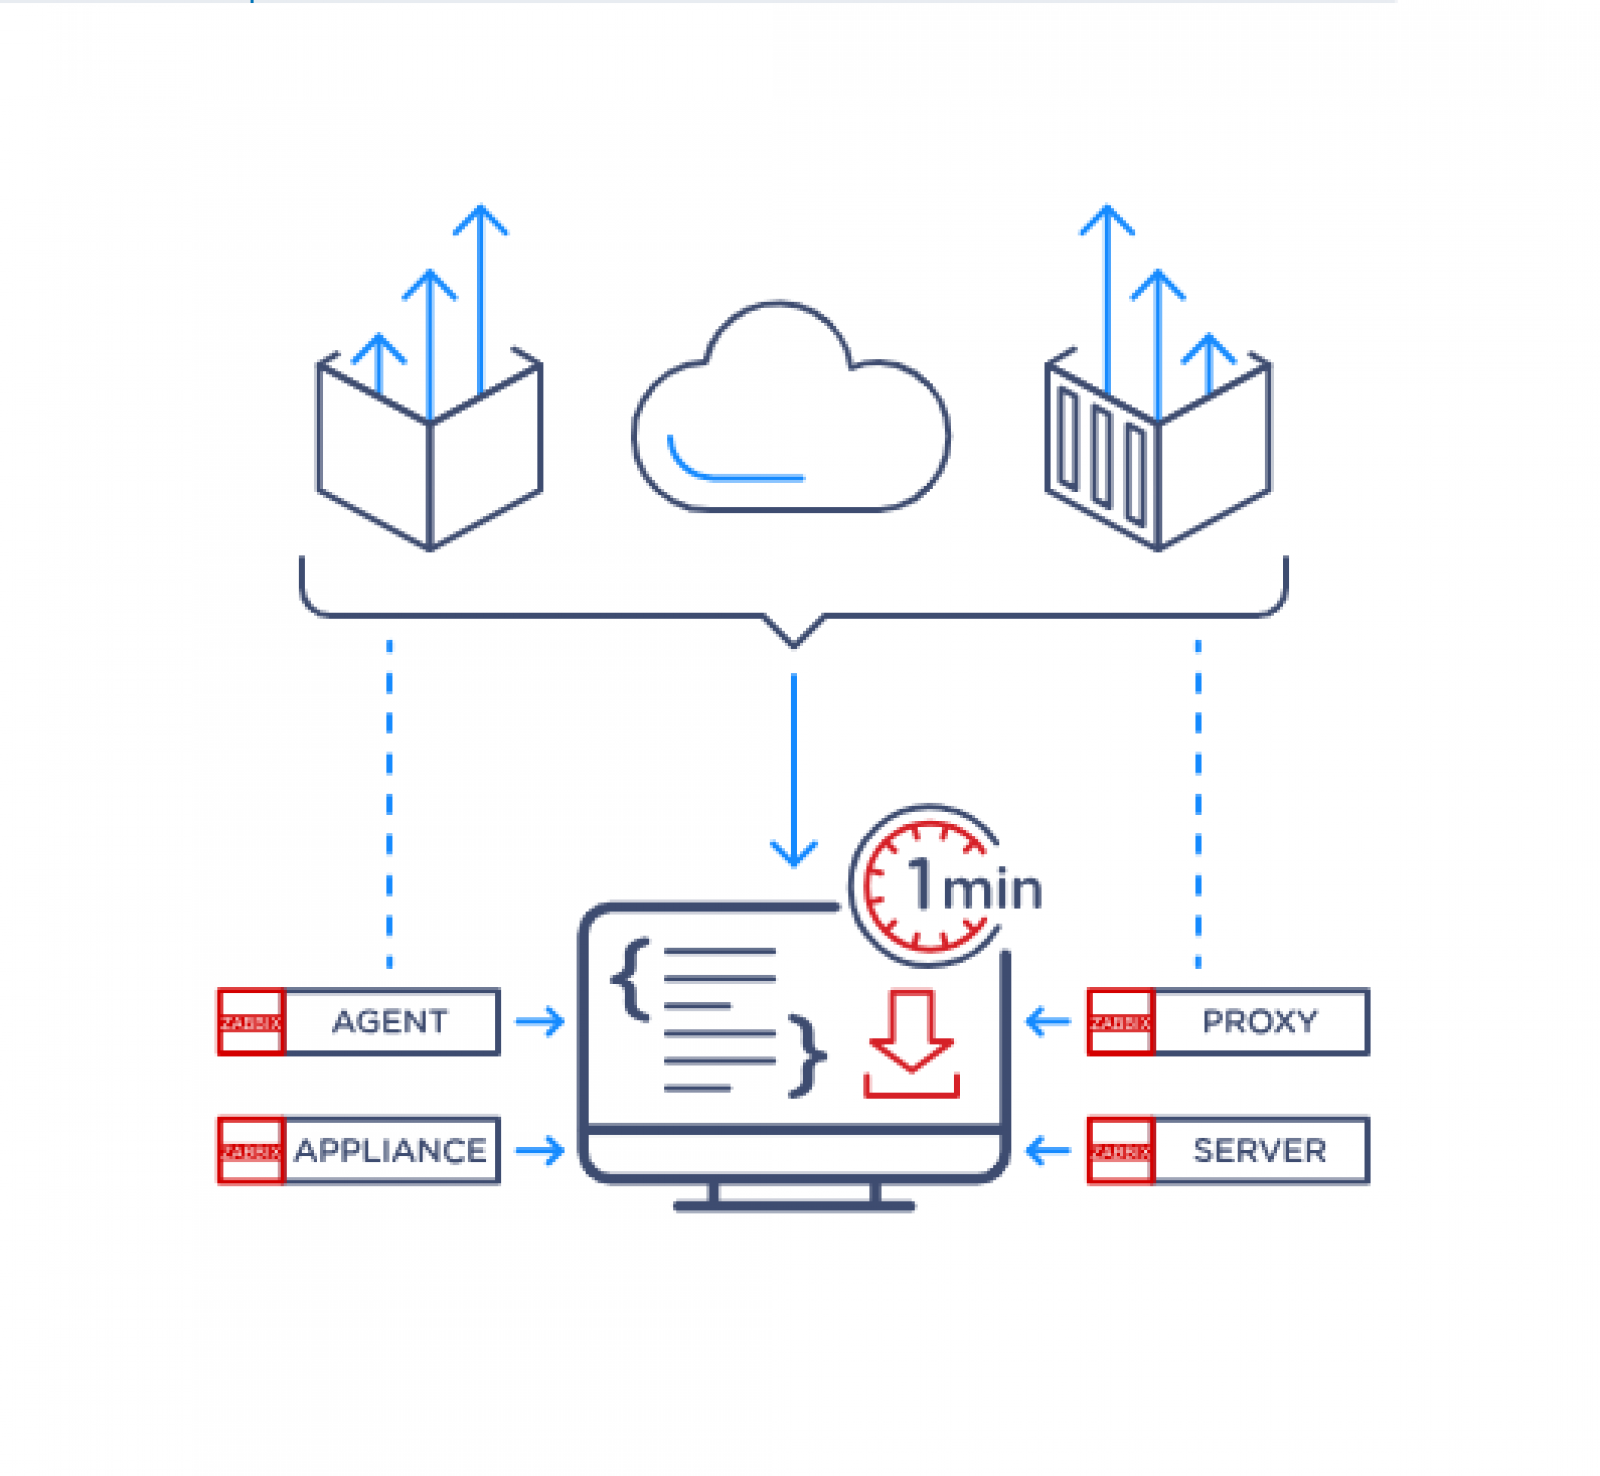
Zabbix server is the central process of Zabbix software.
The server performs the polling and trapping of data, it calculates triggers, sends notifications to users. It is the central component to which Zabbix agents and proxies report data on availability and integrity of systems. The server can itself remotely check networked services (such as web servers and mail servers) using simple service checks.
The server is the central repository in which all configuration, statistical and operational data is stored, and it is the entity in Zabbix that will actively alert administrators when problems arise in any of the monitored systems.
The functioning of a basic Zabbix server is broken into three distinct components; they are: Zabbix server, web frontend and database storage.
All of the configuration information for Zabbix is stored in the database, which both the server and the web frontend interact with. For example, when you create a new item using the web frontend (or API) it is added to the items table in the database. Then, about once a minute Zabbix server will query the items table for a list of the items which are active that is then stored in a cache within the Zabbix server. This is why it can take up to two minutes for any changes made in Zabbix frontend to show up in the latest data section.
Agent Overview:
Zabbix agent is deployed on a monitoring target to actively monitor local resources and applications (hard drives, memory, processor statistics, etc.).
The agent gathers operational information locally and reports data to the Zabbix server for further processing. In case of failures (such as a hard disk running full or a crashed service process), Zabbix server can actively alert the administrators of the particular machine that reported the failure.
Zabbix agents are highly efficient because of the use of native system calls for gathering statistical information.
Passive and active checks
Zabbix agents can perform passive and active checks:
Passive Checks - Zabbix agent responds to a request from Zabbix server (or proxy). For example, the server requests data (e.g., CPU load), and the agent returns the result.
Active Checks - Zabbix agent collects and sends data without waiting for a request from Zabbix server (or proxy). First, it retrieves a list of monitoring items from the server (CPU load, available memory, etc.), then collects the required data and periodically sends new values back to it.
The agent check type is configured by selecting the respective monitoring item type.. Zabbix agent processes items of type "Zabbix agent" or "Zabbix agent (active)".
Agent 2 Overview:
Zabbix agent 2 is a new generation of Zabbix agent, written in Go (with some C code reused from Zabbix agent). It is designed to:
Reduce the number of TCP connections.
Provide improved concurrency of checks..
Be easily extendable with plugins, which provide simple checks with minimal code and support complex checks consisting of long-running scripts and standalone data gathering with periodic reporting.
Function as a replacement for Zabbix agent, supporting all previous features.
Proxy Overview:
Zabbix proxy is a process that may collect monitoring data from one or more monitored devices and send the information to the Zabbix server, essentially working on behalf of the server. All collected data is buffered locally and then transferred to the Zabbix server the proxy belongs to.
Deploying a proxy is optional, but may be very beneficial to distribute the load of a single Zabbix server. If only proxies collect data, processing on the server becomes less CPU and disk I/O hungry.
A Zabbix proxy is the ideal solution for centralized monitoring of remote locations, branches and networks with no local administrators.
Zabbix proxy requires a separate database.
*This information has been shared directly from Zabbix.
Zabbix’s power lies in the synergy of its components—each playing a specific role in data collection, processing, and reporting. By mastering these foundational concepts, you’re well on your way to designing a more resilient and responsive monitoring environment.
Looking to level up your Zabbix skills? A knowledge session with ICT Networks is a great next step:
Fortinet has long been known in the industry for providing you bang for your buck, which is generally viewed at a FortiGate level as performance/throughput vs cost. The numbers stack up nicely for the end customers and when that end customer is a Service Provider (SP) who is constantly looking at...
One of the things I first thought about when HPE announced its plans to acquire Juniper Networks was how will this benefit our customers? We were a long term Juniper Partner with great expertise and a proven track record of supporting our customers across Juniper products and services.